Getting Started
Handle TimeSeries
TimeAtlas is a library to handle time series of any kind. Let’s create a TimeSeries object.
[9]:
from timeatlas import TimeSeries
from pandas import DataFrame, DatetimeIndex

index = DatetimeIndex(['2019-01-01', '2019-01-02', '2019-01-03', '2019-01-04','2019-01-05', '2019-01-06', '2019-01-07', '2019-01-08','2019-01-09', '2019-01-10', '2019-01-11', '2019-01-12'])
my_series = DataFrame([0.4, 1.0, 0.7, 0.6, 0.4, 1.0, 0.7, 0.6, 0.4, 1.0, 0.7, 0.6], index=index)

ts = TimeSeries(my_series)
[10]:
ts
[10]:
            values
2019-01-01     0.4
2019-01-02     1.0
2019-01-03     0.7
2019-01-04     0.6
2019-01-05     0.4
2019-01-06     1.0
2019-01-07     0.7
2019-01-08     0.6
2019-01-09     0.4
2019-01-10     1.0
2019-01-11     0.7
2019-01-12     0.6
Like in Pandas, you can check its main characteristics with TimeSeries.describe()
[11]:
ts.describe()
[11]:
count    12.000000
mean      0.675000
std       0.226134
min       0.400000
25%       0.550000
50%       0.650000
75%       0.775000
max       1.000000
Name: values, dtype: float64
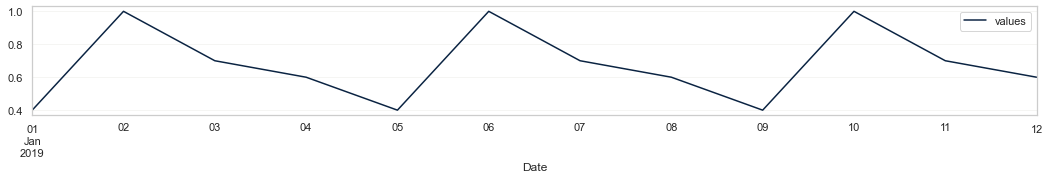
You can visualize it with the TimeSeries.plot() function
[12]:
ts.plot()
[12]:
<AxesSubplot:xlabel='Date'>
What about Metadata ?
TimeAtlas includes a Metadata object allowing you to add some typed metadata object. For instance :
[13]:
from timeatlas import Metadata, types

my_unit = types.Unit("power", "W", "float")
my_sensor = types.Sensor(2902, "HB/floor2/22-23C/Prises_Power_Tot")
my_coords = types.Coords(46.796611, 7.147563)

# You can also use Python dictionaries
my_location = {
    "building" : "Blue Factory",
    "floor" : "12",
    "room"  : "22C"
}

my_dict = {
    "unit": my_unit,
    "sensor": my_sensor,
    "location": my_location,
    "coordinates": my_coords
}

# Create the Metadata object
my_meta = Metadata(my_dict)
[14]:
my_meta
[14]:
{'unit': <timeatlas.types.unit.Unit at 0x7fefd0fd9650>,
 'sensor': Sensor ID: 2902; Name: HB/floor2/22-23C/Prises_Power_Tot,
 'location': {'building': 'Blue Factory', 'floor': '12', 'room': '22C'},
 'coordinates': 46.796611°N, 7.147563°E}
And we can create a TimeSeries object with its associated metadata.
[15]:
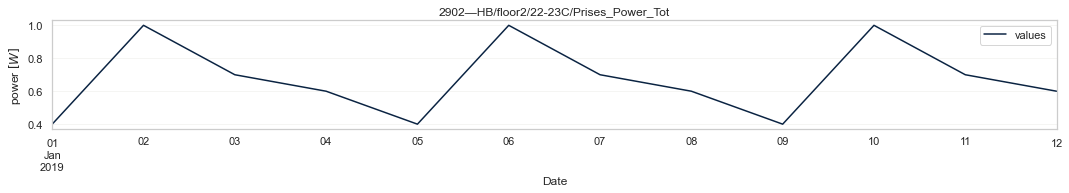
ts_meta = TimeSeries(my_series, my_meta)
[16]:
ts_meta.plot()
[16]:
<AxesSubplot:title={'center':'2902—HB/floor2/22-23C/Prises_Power_Tot'}, xlabel='Date', ylabel='power $[W]$'>
What if time series are multivariate?
TimeAtlas also provides objects to handle time series with many components. It’s capable of padding, slicing, plotting and more with the call of a few functions.
Do you want more examples?
Take a look at different use cases in our user guides. To get a full idea of the functions available in TimeAtlas, check the API reference.