Plotting
[4]:
import numpy as np

import timeatlas as ta
from timeatlas.plots.time_series import status_plot, line_plot, kde_plot
Plotting TimeSeries
TimeAtlas provides different plotting functions for TimeSeries. Per default it creates a line_plot.
[5]:
values = np.random.randn(4 * 24)
values.ravel()[np.random.choice(values.size, 10, replace=False)] = np.nan
ts1 = ta.TimeSeries.create("2020-01-01", "2020-01-04 23:00:00", freq="H")
ts1 = ts1.fill(values)
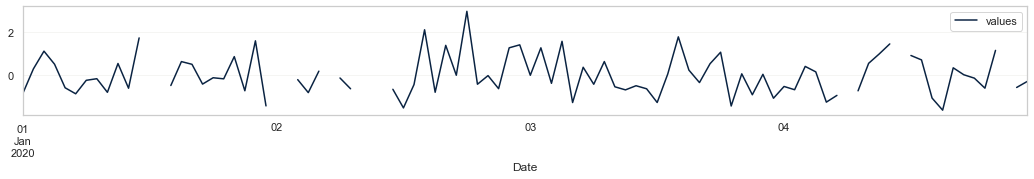
A classic line plot
[6]:
line_plot(ts1, context="paper")
[6]:
<AxesSubplot:xlabel='Date'>
Representing the values in a stauts plot
[7]:
status_plot(ts1)
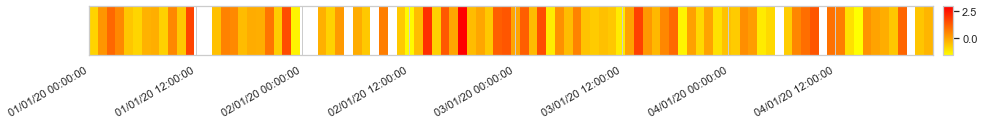
[7]:
<AxesSubplot:>
There are more plots in developments (e.g. kde_plot, etc.) in addition to the plotting for TimeSeriesDataset.